Causal Inference Animated Plots
When you’re learning econometrics, we tend to toss a bunch of methods at you. Here’s multivariate OLS. Here’s difference-in-difference. Here’s instrumental variables. We show you how to perform them, and we tell you the assumptions necessary for them to work, but how often do we show you what they actually do?
On this page, I take several popular methods for getting causal effects out of non-experimental data and provide animated plots that show you what these methods actually do to the data and how you can understand what the effects you’re estimating actually ARE.
You may find it useful to know that whenever I say some variation in A is ‘explained by’ B, I’m talking about taking the mean of A among observations with different values of B. So if Alice’s height is 64 inches, Bob’s height is 72 inches, the average woman is 66 inches, and the average man is 69 inches, then 66 of Alice’s inches and 69 of Bob’s inches are ‘explained by’ gender, and (64-66) = -2 of Alice’s inches and (72-69) = 3 of Bob’s inches are ‘not explained by’ gender.
A couple brief notes:
These graphs are intended to give an intuitive understanding of how these methods make use of and interpret data, not to show the best practices for actually performing the methods. Take these as illustrations, not a set of instructions. This is clearest on the graphs for matching (which shows only one matching method of many), and regression discontinuity (which shows a pretty weak way of performing RDD).
I completely ignore the kind of stuff you’re likely to get in your class anyway: what assumptions are necessary, what kinds of tests to run, what regression functional forms to use, whether you’ve identified an ATE, ATT, LATE, etc..
On that note, you may notice that I actually ignore regression entirely in making these graphs (I do sneak in a correlation or two in some of the explanatory text, but not in the pictures)! You can get the idea for all of these across by just taking means. That’s simple, and simple is good.
If you view the animations on Twitter, you can click them to pause/play.
R code for these graphs is available on GitHub.
How did I draw those causal diagrams? Why, dagitty.net!
Controlling for a Variable
We think that X might have an effect on Y, and we want to see how big that effect is. Ideally, we could just look at the relationship between X and Y in the data and call it a day. However, there are plenty of reasons this might not work! For example, there might be some other variable W that affects both X and Y. This is illustrated by the below causal diagram:
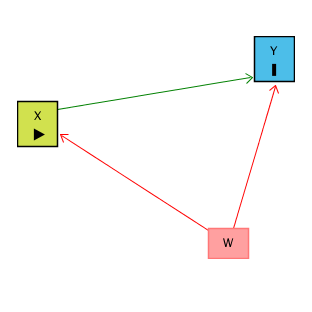
When this happens, the relationship we see between X and Y in the data (the “raw” relationship) will reflect two things: the effect of X on Y (the part we’re interested in), and the way that W affects both X and Y (the part we’re not interested in!). W gives us a back-door path from X to Y. We can get from X to Y either through the X → Y path (which we want), or the X ← W → Y path (which we don’t).
For example, say X is education and Y is earnings, and W is intelligence. We observe that more-educated people tend to earn more money. Part of this is because education causes wages to rise, but part of this is because more-intelligent people on average are more likely to get an education and also would have likely earned more anyway.
One way to solve this problem is to close the back-door path by controlling for W. The idea is that we want to look at the relationship between X and Y while removing the influence of W. Another way to think of it is looking at the relationship between X and Y among people with the same level of W. When we do this, we close X ← W → Y, leaving just X → Y, which is what we’re interested in! After we control for W, the remaining relationship between X and Y is causal (assuming the only back-door path was through W).
So how can we look at the relationship between X and Y while removing the influence of W? The way we do this with controlling is to remove the parts of X and Y that are explained by W. Whatever parts of X and Y we can predict using W, those are the parts we need to take out in order to close that back door and make sure we’re comparing among people with the same level of W.
If W is a binary variable (only takes two values), this is how controlling for W looks:
Matching on a Variable
There’s a policy treatment called Treatment that we think might have an effect on Y, and we want to see how big that effect is. Ideally, we could just look at the relationship between Treatment and Y in the data and call it a day. However, there are plenty of reasons this might not work! For example, certain kinds of people might be more or less likely to get Treatment, and those people might have higher or lower values of Y anyway. Let’s say people with certain values of X are both more likely to get treatment and have certain values of Y. This is illustrated by the below causal diagram:
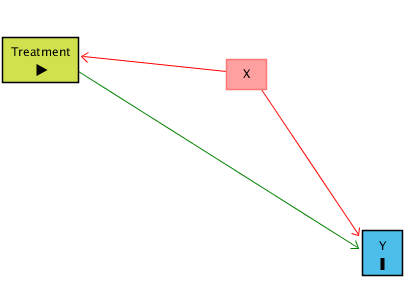
When this happens, the relationship we see between Treatment and Y in the data (the “raw” relationship) will reflect two things: the effect of Treatment on Y (the part we’re interested in), and the way that X affects both Treatment and Y (the part we’re not interested in!). X gives us a back-door path from Treatment to Y. We can get from Treatment to Y either through the Treatment → Y path (which we want), or the Treatment ← X → Y path (which we don’t).
For example, say Treatment indicates that a city that improved its roads in 2014, and Y is that city’s GDP growth in 2015. We observe that Treatment cities grew faster the next year than non-Treatment (Control) cities. Part of this is because the roads cause GDP to grow, but part of this is because cities that were already growing fast were more likely to have the money to fund road growth. In this case, X is GDP growth before 2014.
One way to solve this problem is to close the back-door path by matching on X. The idea is that we want to look at the relationship between Treatment and Y among cities with the same values of X. Another way to think of it is looking at the relationship between Treatment and Y while removing the influence of X. When we do this, we close Treatment ← X → Y, leaving just Treatment → Y, which is what we’re interested in! After we control for X, the remaining relationship between Treatment and Y is causal (assuming the only back-door path was through X).
So how can we look at the relationship between Treatment and Y among cities with the same values of X? The way we do this with matching is to take Treatment cities, and then compare them only to Control cities that have the same or very similar values of X.
If Treatment is a binary variable (only takes two values), this is how matching on X looks:
[Note there are plenty of different ways to do matching besides this, but the same general concept applies - we are looking for non-Treatment observations that have the same or very similar values of the matching variable(s) as the Treatment observations]
Instrumental Variables
We think that X might have an effect on Y, and we want to see how big that effect is. Ideally, we could just look at the relationship between X and Y in the data and call it a day. However, there are plenty of reasons this might not work! For example, there might be some other variable W that affects both X and Y. This is illustrated by the below causal diagram:
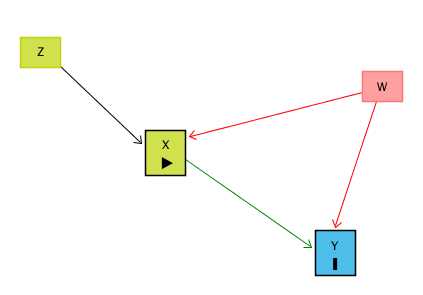
When this happens, the relationship we see between X and Y in the data (the “raw” relationship) will reflect two things: the effect of X on Y (the part we’re interested in), and the way that W affects both X and Y (the part we’re not interested in!). W gives us a back-door path from X to Y. We can get from X to Y either through the X → Y path (which we want), or the X ← W → Y path (which we don’t).
However, notice that in our diagram we also have the variable Z that affects X, but there are no back-door paths from Z to Y once you close off X. All of the effect of Z on Y goes through X. When this happens, if we isolate just the part of X that is explained by Z, there’s no back-door path through W, since we’ve picked out just the part of X explained by Z. Since Z has nothing to do with W, that part of X we’ve isolated has nothing to do with W! So there’s no back-door path.
For example, say X is parental income and Y is child health. W is parental health, which is likely to affect child health (some illnesses are genetic or contagious) and parental income (it’s hard to work if you’re sick). Z might be random assignment to a welfare program that sends the parent a check every month. If the check makes your income go up, that has nothing to do with parental health (it’s randomly assigned!), and so we don’t need to worry about the parental health back door.
One way to solve this problem is to use Z as an instrumental variable for X. The idea is that we are isolating only the variation that’s due to Z. And since Z has nothing to do with W, W isn’t causing problems for us any more. Another way to think of it is that, while X ← W → Y is a back door, there’s no back door for X* ← W → Y*, where X* and Y* are only the parts of X and Y that are explained by Z. So we can estimate X* → Y* with the instrumental variable.
It’s a little bit like the opposite of controlling for a variable. Instead of getting rid of all the parts of X and Y explained by the variable we control for, we’re getting rid of all the parts of X and Y not explained by our instrument.
If Z is a binary variable (only takes two values), this is how using Z as an instrument for X looks:
Fixed Effects
We think that X might have an effect on Y, and we want to see how big that effect is. Ideally, we could just look at the relationship between X and Y in the data and call it a day. However, there are plenty of reasons this might not work! For example, there might be all sorts of differences between people that lead them to have different levels of X and different levels of Y. This is illustrated in the below causal diagram:
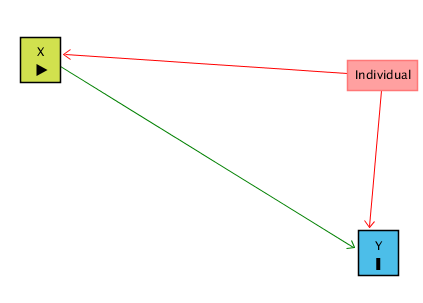
In the graph “Individual” represents anything about the individual people/firms/cities/countries we’re looking at that doesn’t change over time. When this happens, the relationship we see between X and Y in the data (the “raw” relationship) will reflect two things: the effect of X on Y (the part we’re interested in), and the way that individual characteristics affect both X and Y (the part we’re not interested in!). Individual gives us a back-door path from X to Y. We can get from X to Y either through the X → Y path (which we want), or the X ← Individual → Y path (which we don’t).
For example, say X is the level of education a CEO has and Y is a firm’s profits in a given year. Different kinds of firms might be more profitable and also more or less likely to hire a highly-educated CEO. Who knows what those differences are - conveniently, we don’t actually need to measure them all. Fixed effects basically asks how each given firm performs comparing years where that firm has a more-educated CEO vs. years where that firm has a less-educated CEO. So in order for this to work, we need to observe each firm multiple times (in “panel data”) so that we have multiple periods to compare.
We can close the back-door path through Individual using fixed effects as long as we observe each individual multiple times. The idea is that we want to look at the relationship between X and Y within each person. Another way to think of it is that you’re “controlling” for who each individual is. When we do this, we close X ← Individual → Y, leaving just X → Y, which is what we’re interested in! After we control for Individual, the remaining relationship between X and Y is causal (assuming the only back-door path was through Individual).
So how can we look at the relationship between X and Y within each individual? The way we do this with controlling is to remove the parts of X and Y that are explained by the individual identities. Whatever parts of X and Y we can predict using individual identity, those are the parts we need to take out in order to close that back door and make sure we’re comparing X and Y only within-individual.
Difference-in-Differences
There’s a group of people, let’s call them Treated, who at a certain point had a new policy applied to them. We can observe them both Before the treatment went into effect, and After. We think that the policy treatment might have had an effect on Y. Ideally, we could just look at whether Y went up After Treatment, compared to Before, and call it a day. However, there are plenty of reasons this might not work! Y might have risen for all groups at the same time that treatment was imposed, not just for the Treated group. This is illustrated in the below diagram:
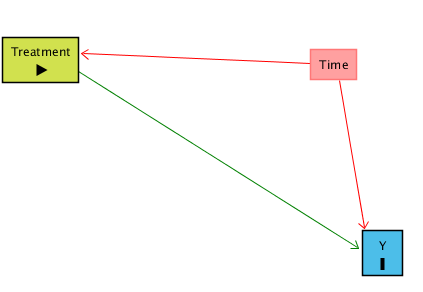
For example, say Treatment is a particular office switching from cubicles to an open office, and Y is productivity. They make the switch on January 1, 2017, so Before Treatment might be 2016 and After Treatment might be 2017. But the economy also improved from 2016 to 2017, so maybe the increase in productivity has nothing to do with the open office.
When this happens, the difference between Y Before treatment and Y After treatment for the Treated group will reflect two things: the effect of Treatment on Y (the part we’re interested in), and the way that Y may have changed over Time for reasons unrelated to Treatment (the part we’re not interested in!). Time gives us a back-door path from Treatment to Y. We can get from Treatment to Y either through the Treatment → Y path (which we want), or the Treatment ← Time → Y path (which we don’t).
Even worse, we can’t close this back door by controlling for Time if we only look at the Treated group, since Time perfectly predicts Treatment (it’s either Before and you’re not treated, or After and you are) - so if we remove all parts of Treatment explained by Time, there’s nothing left!
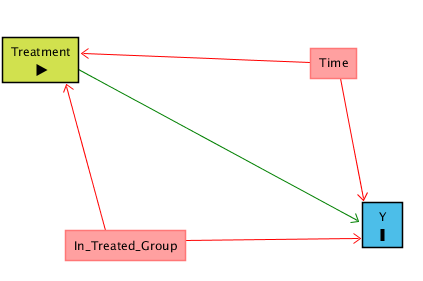
What can we do? We can add a Control group that never gets treated (in our example, an office that keeps its cubicles throughout 2016 and 2017). This is going to let us control for Time, but introduces the problem that now we have another back door, since the Control and Treatment groups may be different. In the below diagram, a person receives “Treatment” only if they are in the Treated group AND in the Time period AFTER treatment is applied. In addition to our Time back door, we also have a back door from Treatment ← In Treated Group → Y that we need to close:
We can close both back-door paths through Time and In Treated Group using Difference-in-Differences. The idea is that we look at how much Y changed from Before to After in the Treated group, and also how much Y changed from Before to After in the Control group (those are the Differences).
Looking at these differences separately for Control and Treatment is a way of controlling for In Treated Group, closing the Treatment ← In Treated Group → Y back door. Then, we take our Before/After difference for the Treated group and subtract out the Before/After difference for the Control group (the Difference in the Differences). We just took out the Before/After difference that was explained by Time for the Control group, in effect controlling for Time and closing the Treatment ← Time → Y back door.
The below animation shows how this works:
Regression Discontinuity
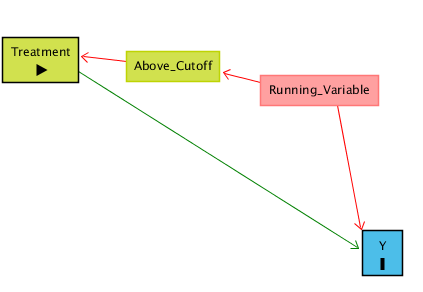
There’s a policy treatment called Treatment that we think might have an effect on Y, and we want to see how big that effect is. Ideally, we could just look at the relationship between Treatment and Y in the data and call it a day. However, there are plenty of reasons this might not work! For example, certain kinds of people might be more or less likely to get Treatment, and those people might have higher or lower values of Y anyway. In fact, in this case, treatment is assigned based on a Running Variable. If your Running Variable is Above a certain Cutoff, you get treatment. If it’s below, you don’t. However, the Running Variable might also predict Y. This is illustrated by the below causal diagram:
For example, say Treatment is getting into a Gifted and Talented school program, Y is attending college, and the Running Variable is test scores. Students who get a test score is above 90 are assigned to Gifted and Talented, and those below 90 can’t get in. The Gifted and Talented program might help you attend college, but also, students with higher test scores are more likely to attend college anyway.
When this happens, the relationship between Treatment and Y will reflect two things: the effect of Treatment on Y (the part we’re interested in), and the way that Running Variable affects both Treatment and Y (the part we’re not interested in!). Running Variable gives us a back-door path from Treatment to Y. We can get from Treatment to Y either through the Treatment → Y path (which we want), or the Treatment ← Above Cutoff ← Running Variable → Y path (which we don’t).
We can close the back door by controlling for Running Variable. The best way to do this is to look at how Running Variable explains Y, and then focusing in just on the part right around the cutoff. This ensures that we’re comparing Treated people to Untreated people who have basically the same values of Running Variable, effectively controlling for Running Variable.
Why compare right around the cutoff rather than controlling for Running Variable normally, like we did up higher on this page? Because among the people right around the cutoff, it’s nearly random whether they were just above or just below the cutoff. And because it’s nearly random, if there’s some other back door path we haven’t noticed, we’ll be closing that too. So if the real diagram actually looks like:
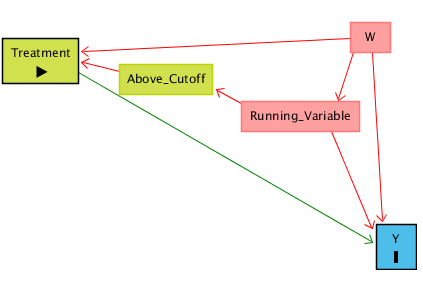
Then by focusing just on the area right around the cutoff, we can isolate the Above Cutoff → Treatment → Y path and ignore the Treatment ← W → Y back door.
The below animation shows how this works:
As a note, if the Running Variable is time, then this is what’s known as an Interrupted Time Series, or Event Study. Of course, for these studies it may not be true that limiting things just to the cutoff closes the Treatment ← Above Cutoff ← Running Variable → Y path, since time is different before and after the cutoff, and other things may have changed!
When Controlling Hurts!
Collider Variables
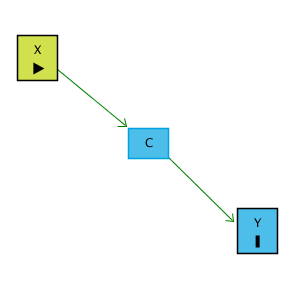
Since we can control for variables to help close back doors and identify a causal effect, it sort of feels like we should control for whatever we can! But this is not the case - sometimes, controlling for something can do bad things. For example, say there are two variables, X and Y, that we think don’t have a direct relationship. However, we think that both of them affect a variable C. We call C a “collider” because the arrows “collide” together at C. This can be seen in the below causal diagram:
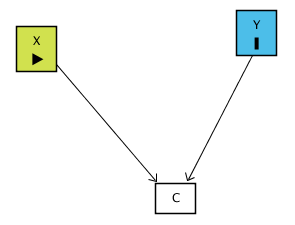
For example, say you’re looking at data of people who interviewed for a programming job. X is programming skill, Y is social skill, and C is being offered a job after the interview. People are likely to be offered the job if their combination of programming and social skills passes some level. So the people getting the offer will either be super-great programmers with bad social skills, super-awful programmers with great social skills, or some middling combination of both.
Now, we don’t think there’s a relationship between X and Y, but we wonder if maybe we’re wrong, and so we decide to look at them together and see if they’re related. And, since we know they’re both related to C, we decide to control for C.
But we shouldn’t control for C, because there are no back doors to close. Because the arrows collide at C, the path X → C ← Y is in fact already closed. Controlling for C will actually open that back door back up and we will no longer know the effect of X on Y.
When we control for a collider, we will actually create a correlation between X and Y that isn’t really there. X and Y are unrelated overall, but because C selects for certain combinations of X and Y, X and Y will be related among people with the same level of C. And recall - what you do when you control for a variable is look at the relationship between X and Y among people with the same level of the control variable. So if there’s really no relationship between X and Y, it will look like there is one. And even if there is a relationship, we’ll get it wrong, because we have opened up a back door.
The below animation shows how this works:
Post-Treatment Controls
Since we can control for variables to help close back doors and identify a causal effect, it sort of feels like we should control for whatever we can! But this is not the case - sometimes, controlling for something can do bad things. For example, say there is a variable X that we think has an effect on Y. However, it has an effect on Y because it has an effect on C, and C has an effect on Y. We call C post-treatment because it is affected by the variable we want to know the effect of, X.
For example, say X is the price of cigarettes, Y is health, and C is the number of cigarettes smoked. The price of cigarettes has an effect on your health only because it reduces the number of cigarettes you smoke.
Now, we want to know the effect of X on Y. And since we know C affects Y, we decide to control for C as well.
But we shouldn’t control for C, because C doesn’t close a back door! C is along the path we want to pick up, X → C → Y. If we control for C, not only does that not close a back door, it shuts down the path we want! It will look like there’s no effect of X on Y, even though there is one.
The below animation shows how this works:
It’s worth noting that a post-treatment variable doesn’t necessarily need to cause Y to cause problems! Consider a post-treatment variable C that doesn’t cause Y, but there is a correlation between C and Y through C ← W → Y, like in the below diagram:
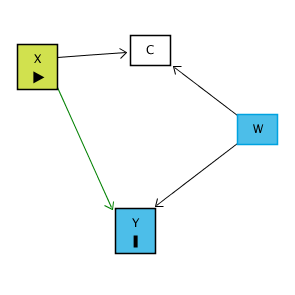
Since C here is a collider variable and X → C ← W, there’s no open back door from X to Y. However, if we control for C, that pathway opens back up, and X → C ← W → Y becomes an open back door, giving us a problem!